

In the part 5 of this article series, I studied the project management tools including the requirement of Earned Value (EV) in project metrics, digital dashboards, use of the digital dashboard tool, and the Earned Value Analysis in Green Hydrogen Production Project that shows how the live green hydrogen or green energy projects can be managed by the project management team, and monitored by the steering committee, shareholders and other financial entities which are involved in this project. The following sections of my article will demonstrate the other and many critical tools how to manage the green hydrogen projects but it is not limited to only for such green energy projects, and applicable in other construction projects regardless the type of the projects.
Contents (part 5)
10. Project Management tools for the Green Hydrogen Production Project
10.1 Requirement of Earned Value in Green Hydrogen Production Project Metrics
10.2 Digital Dashboards for Green Hydrogen Production Project
10.3 Digital Dashboard Project Tool Use
10.4 Green Hydrogen Production Project Earned Value Analysis
10. Project Management tools for the Green Hydrogen Production Project
For high level reporting and monitoring of the project, Digital Dashboard DD can be used to quickly update the status of a project, to enable project decision making and team engagement, and how earned value (EV) analysis can assist the project management team to control the project, Forman, J. B., & Discenza, R. (2006), (47).
Green Hydrogen Production Project integration in turn necessitates collecting performance data in order to expedite the process and cut down on the amount of time executives spend overseeing it. Project integration is very much dependent on Project Management teamwork that requires communication, measurement, and reporting for executive management.
10.1 Requirement of Earned Value in Green Hydrogen Production Project Metrics
The nature of business necessiates the upgrading, collection, organization, dissemination, and utilization of project information in day-to-day operations. Underestimation, underfunding, resource limitations, and the incorrect people in charge of huge efforts affect the whole business. Digital dashboards and other low-cost collaboration tools have the potential to greatly benefit for the management of the project.
Business and project management literature increasingly emphasizes “digital dashboards” as a means of delivering performance indicators and collaborating on project decisions. Project management and planning, encompassing all stages of a project, have also benefited from digital dashboards.
10.2 Digital Dashboards for Green Hydrogen Production Project
Digital dashboards can track the flow of information on projects. Users may monitor high level activities and delve down into low level data graphically. Key performance indicators are vital for the success of a digital dashboard. Business users from Green Hydrogen Production Project Steering Committee members, and senior management and many more can configure digital dashboards to the data and analytics they need most.
10.3 Digital Dashboard Project Tool Use
Digital dashboards have many benefits. All activities contributing to project success must be connected so the project management and in high level the steering committee can monitor and track their progress. Using this centralized database, executives may assess how well their project organizations are doing and evaluate project organization performance. It enables the organization to collect and report data from each project activity, creating a “snapshot” of performance. Accordingly, observations of operational changes can be made with ease.
10.4 Green Hydrogen Production Project Earned Value Analysis
This necessitates the use of an information system that tracks project progress and performance against a project plan in order to deliver a product or service on time, within budget, and in the format requested by the shareholders as the client. The digital dashboard of a project control system can serve as the primary interface between the project management and the steering committee.
Most organizations struggle with project control. One of the most ignored elements of project management, it holds individuals accountable, permits traceability, and focuses a project. A strong control system will utilize the information about the Project’s stand in terms of time, money, and schedule, cost, completion time, the required actions for potential issues and concerned issues that would cause the budget or schedule overruns.
An effective project control system requires EV analysis as detailed in the formulae for earned value variance and indices below. Project Management teams can use EV to examine more than just project timelines and costs. On such green hydrogen production projects, EV helps identify activities that require further analysis for potential concerns. Comparing the total project spend-to-date to expected expense will not reveal whether the project completed the same amount of work. Although EV analysis is a simple addition to financial accounting, few accountants and chief financial officers are aware with it.
10.4.1 The calculation for earned value (EV) variance and indices
All variances are determined in terms of cost and are applicable to all measurement methods. Five different kinds of variations or indice, Earned Value Management, APM Knowledge (2013), (48) are often used.
SV: Schedule variance, the financial comparison between actual earnings and budgeted amounts. It quantifies the disparity between the anticipated work and the work actually completed:
SV = BCWP – BCWS, SV% = (SV/BCWS) x 100
CV: Cost variance, which is the comparison of the amount earned and the amount spent:
CV = BCWP – ACWP, CV% = (CV/BCWP) x 100
VAC: Variance at completion, the comparison of the budget at completion with the current estimate at completion:
VAC = BAC – EAC, VAC% = (VAC/BAC) x 100
SPI: Schedule performance index, a metric indicating the project’s progress relative to the planned work, measured by the value of completed tasks; it approaches 1.0 as the project advances. It is of less value as the project nears completion:
SPI = BCWP/BCWS
CPI: Cost performance index, a metric comparing earned value to actual expenses. Values below 1.0 are unfavorable; values above 1.0 are favorable:
CPI = BCWP/ACWP
Figure 5’s graph is an EV graph including trend analysis graph that shows how the project varies as of the report date. The graph displays the tasks that need to be completed as well as any trends, whether positive or negative trends that may exist. Project progress and direction are reported on the “assessment date”(Time”now”, ATE).
Budgeted work achieved value (BCWP), baseline budgeted cost (BCWS), and project actual cost (ACWP) make up the three lines.
From the date of the report to the new anticipated completion date, with updated EAC projections, the dotted line displays EAC forecasts. That means actual finishing costs will be different from estimates. The extra amount that is expected to be spent on the project (forecast cost overrun) from today’s evaluation date to the overall price is shown in Figure 5.
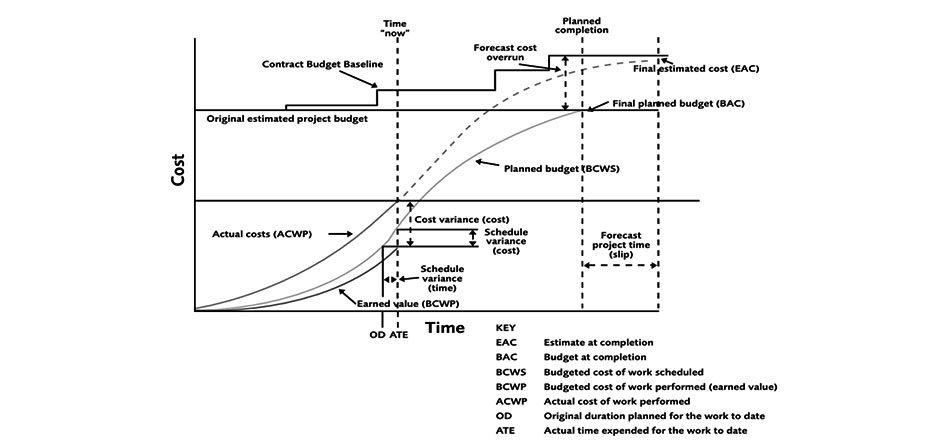
Figure 5: EV graph including trend analysis; Earned Value Management, APM Knowledge (2013), (48).
To forecast future performance and project completion indicators, EV is better since it deals with the “iron triangle” of time, money, and scope. When using EV analysis, it is more realistic to provide schedule and cost deviations and to predict project completion dates and costs based on current performance patterns.
10.4.2 Defining Requirements and Creating a Digital Dashboard
The Requirement is the level of intricacy inside digital dashboards that might vary. A lot like a car dashboard, this one needs to be adjusted so the operator can see a “feed” of up-to-the-minute data as they carry out other critical tasks. This statement includes all digital dashboard performance criteria.
The Challenge;More and more company data is being collected and recorded using sophisticated enterprise resource planning (ERP) systems and bespoke line-of-business (LOB) software. Data about how well a project is doing is available in a lot of enterprise data systems. The Human Resources time reporting system will record resource hours, ERP payables will record material and subcontractor costs, and the company’s custom payroll system will record labor costs.
It is challenging to mine this data across platforms. The IT department is typically in charge of handling database queries, which are necessary to access certain data. While some project performance data may be stored in enterprise resource planning (ERP) systems with standard query interfaces, other data may be in proprietary legacy databases that lack an interface or be presented in standardized reports that may not address all the queries asked by project managers or company executives. Producing the necessary information at the required level of detail often requires an expensive, one-time solution that cannot be easily replicated for other projects or done by project team members without assistance from the IT department.
One possible solution is to combine reports or merge data from multiple databases, assess it, and then make it available online to the executives and then filtered data in high level presentation will be done to this green hydrogen project’s steering committee, corporate portfolio managers, and anybody else with an interest.
A digital dashboard solution enables the green hydrogen production project management team to share real-time performance data with the project steering committee, stakeholders and executives, ensuring minimal risk to live data. Timely estimates, performance indicators, and secure, regular updates can be sent to approved dashboard subscribers by aggregating, analyzing, and altering data.
10.4.3 Creating the Dashboard
When it comes to digital dashboards for project information, Microsoft Excel is a straightforward platform to use. For simple financial and analytical purposes, Excel is utilized by the majority of executives, stakeholders, and project workers in an enterprise. Based on the variables in the accessible cells, Excel’s corporate graphics “engine” generates a variety of pre-formatted graphs, pie charts, histograms, and other visual presentations.
Project management software like Microsoft Project is used by many professionals. Project can export key project metrics directly onto an Excel-based digital dashboard for collection, analysis, and display. The digital dashboard displays project essential performance data exported to Excel from Project EPM’s database platform, SQL Server. Figure 6 depicts a sophisticated digital dashboard with multidimensional analysis via pivot tables.
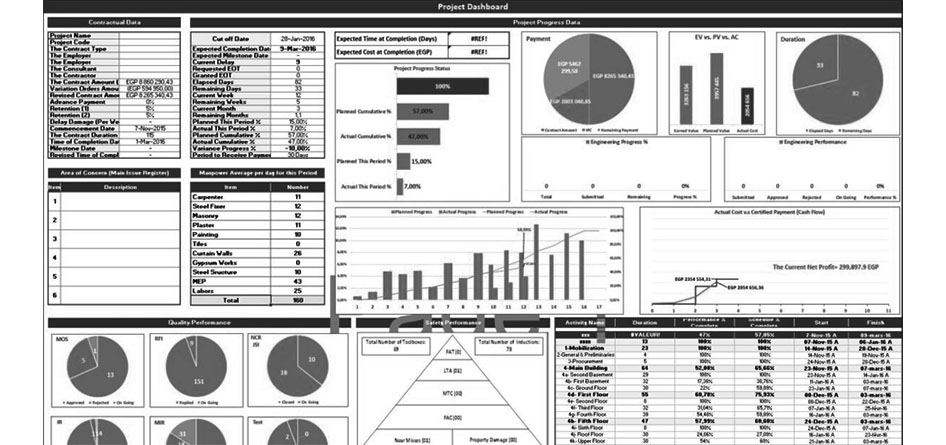
Figure 6. Project Digital Dashboard Template, By The Engineering Community, (2019), (49).
10.4.4 Advantages of Digital Dashboards
Using digital dashboards to display critical project data will expedite the sharing of project performance information with the steering committee executives and stakeholders. As a result, there will likely be a dramatic shift in how the green hydrogen production project is decided upon, with time zones and delays being rendered irrelevant in the pursuit of success.
Reporting on EV performance has always been clear on data and graphics for digital dashboards CPI, SPI, and “S” curve graphs give a lot of information in clarity, perfect for the Digital Dashboards of the corporate leaders of this decade.
This study clarifies that digital dashboards are the best way to quickly share project metrics with the project steering committee, stakeholders, executives, and other collaborators.
To be continued…